
This series of blog posts which I have converted from Youtube videos. I personally have really enjoyed these videos so in order to textually document them, these are essentially some screenshots and rough notes organised.
This particular post is based on the awesome Addy Osmani’s talk at JSConfEU 2017. It can be found on the link https://www.youtube.com/watch?v=7vUs5yOuv-o
Today’s guide to instantly load everything.
Welcome to 21st century. This is the time where software applications are not solely relying on back-ends but a great user experience and interface also plays a key role in the success of your software. When it comes to mobile and web apps, a robust UI is a must. By that, we mean it is although feature rich, yet loads instantly. Today we are sending thousands on bits to upload better and more interactive front ends of our software and apps. To make our frontends more interactive and responsive we add new features every day in them. This also makes our apps heavier and the loading time increases. This is where the capability of the frontend developer comes into question. They need to optimize how they can help their front ends load better with all the feature rich interactions.
Facts for today’s world of Javascript:
- It takes 16 seconds for any web page, whether it is built with a Java script framework or a simple static page, on a real mobile device on 3G to get interactive with the user.
- It usually takes the same about 19 seconds to be fully loaded.
- 250-400KB of Java script is usually sent down by people down the wire.
How does it work?
So let’s take a look at how a browser is able to get anything loaded to a screen from the network. It seems quite simpler than it actually is. When you try to access a website through a browser:
- It sends a request to the network which in return responds to it by HTML.
- Similarly, we parse the request for CSS, JS or images, and anything else that comes back from there.
- After that, we basically parse CSS, Java and any other data type that comes in, compile and then render it for the pixels on the screen.
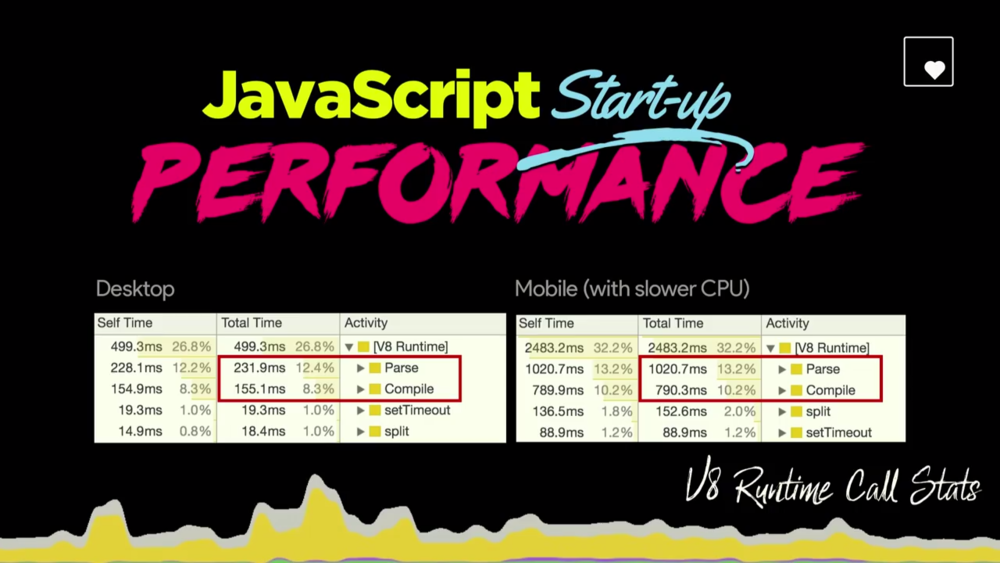
The truth is, it isn’t quite that simple. So what happens is we are developing usually on desktop machines which are high end and relatively better at computing and speed. Whereas, for mobile phones, it is quite different. Usually, for a desktop, it takes about ~200ms to parse the code whereas, for mobile phones, that is four to five times more. So how do we really optimize this time to be able to load the code better and give interactivity to the user faster?
A lot of people use CPU throttling or emulations to test their web pages which are a good step but better can be done. The main reason for so is that for mobile phones, each one has a different characteristic, different CPUs and so on, which means that each device cannot be generalized to fit in the same expected time to interactivity. So one good tool to use here is webpagetest.org/easy. This website has a lot of mobile phone profiles to use to test your web page and get accurate performance results.
5 seconds, a web page should take to load anything useful or give anything useful for interacting with to the user.
Load Only What You Need:
The key to making web pages more performance efficient, is to load only what you need; that is, prioritize the codes or objects in your web pages in order of requirement or necessity so that within every 5 seconds, you are able to provide useful interactivity to the user.
One way this can be achieved is by code splitting. Code splitting can be set up easily using webpack, splittable or other compilers from browsify. So the basic idea behind coding can be explained simply an example, that instead of giving the user the whole pizza in one go and making it fully loaded, you give it one piece at a time, in order to maximize their experience of what basically you are delivering to them.
Another way to do so is tree shaking which allows you to get rid of unnecessary exports that may cause delays, for instance, roll ups, etc. can be considered being excluded from the initial loading.
A useful tool we have called appshot with a feature called code coverage which helps you determine which code blocks are being executed at the time of loading and which ones are idle. By using this tool, you can choose to only load the code blocks which are necessary for the website.
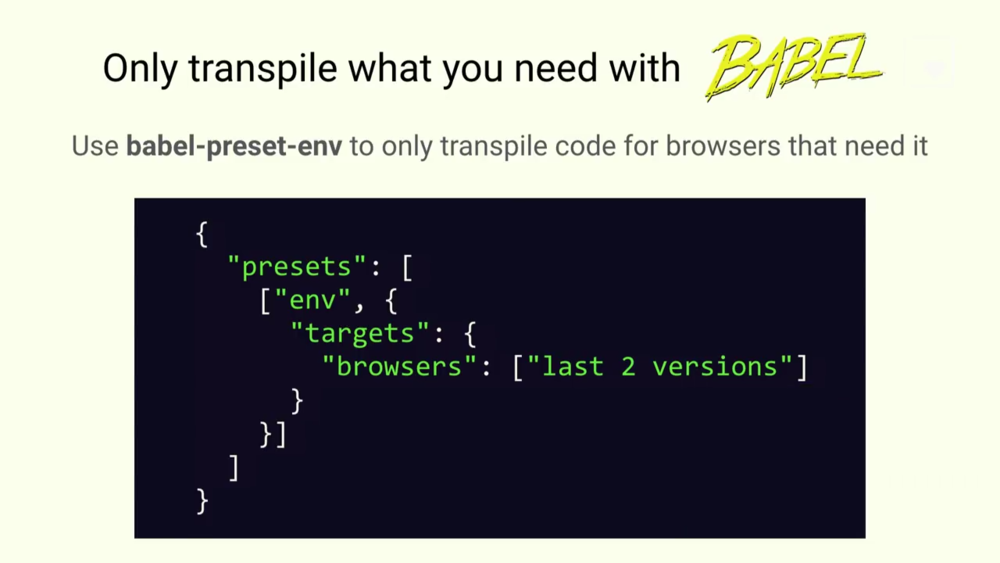
Another useful platform to the only ship out the code to those browsers who need it while cross browsers, is transpiling using Babel’s Babel-preset-env. Another one is Lodash. So if you are using lodash to load your code, you can use Babel-plugin-lodash to load only the modules you require instead of loading the whole package.
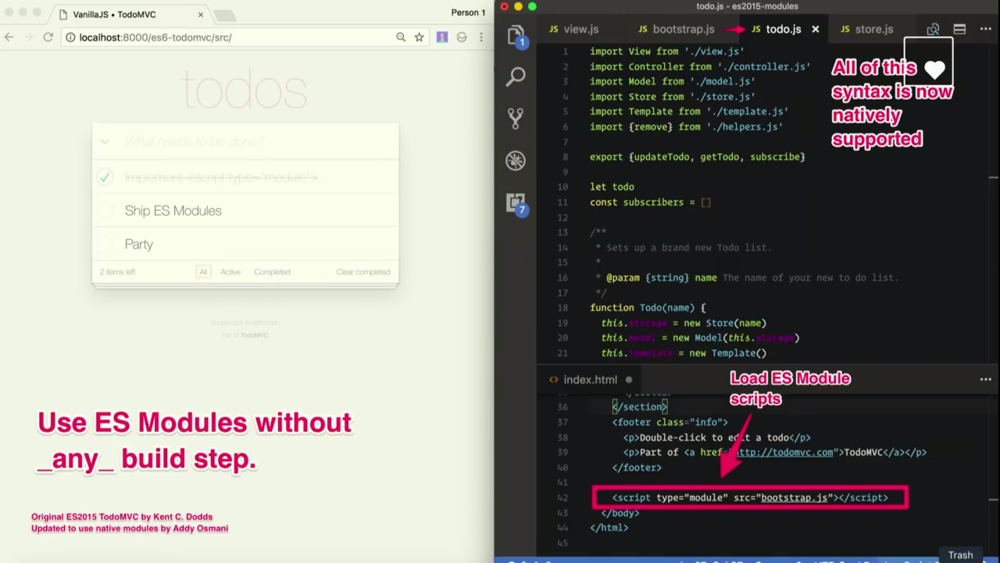
So Chrome now also supports ES Module, therefore, allowing more support for less transpilation and more opportunities for more interesting loading experiences across the board.
Order Loading Thoughtfully:
You know it better what needs to be shipped to the user on a priority basis and what not, therefore there is another option called network request blocking that allows you to block URL requests usually from third parties URL on the page that slows down the loading. It can be done by right clicking on the respective URL and choose to block URL request.
Cache Aggressively:
Cache as much as you can locally and granularly. At Inbox, they figured a 10% decrease in time to interactivity by using Static Resource Caching.
So, what we are going to do now is hack Chrome to make JSCONF.EU more interactive. You dive into resource fetcher file in CPP format. So code here basically tells Chrome which objects to prioritize loading by setting return to ResourceLoadPriorityVeryHigh. Here’s a table to tell how it really prioritizes; like fonts are prioritized whereas CSS mismatch is given least priority.

So, to make use of this, in the network panel and the column called priority, you will find that it lists what is actually prioritized for all resources that are loaded. Let’s try setting all objects to priority very high and see how that works out.
So, basically what happens is that all meaningful interactivity gets loaded along with everything else causing useful panes to be delayed. Whereas, with different priorities, with every couple of seconds, an interactive module gets loaded for the user to interact with. Hence, setting priorities with respect to the usage of those code blocks and resources in the web page is a better option to increase the performance of that web page.

A browser preload scanner contributes to web page performance as well. The preload scanner is able to look ahead of blocked resources and able to fetch any other resource or code block that might be necessary. When a preload scanner was introduced in Chrome it showed a 20% increase in performance.
Focus on Discovery
Now another issue that may arise is discovery. Your browser doesn’t know in what sequence to load packages or even what packages to choose to load in order to increase the web page performance. You know that better. Therefore you can use link `rel = preload` to actually set priorities to the scripts to load first which may include Java, CSS, etc. based upon your web page’s structure.

What it does is shift the preload time to parsing allowing it to work its way through to a better performing web page. Webpack plugin called webpack preload plugin is available that allows you to do preload on synchronous chunks as well as stand-alone ones.
An application called Shop designed by Polymer Team used awebpack plugin to see how smooth and modern can the experience be made of using an application. And it turned out they were able to do so by granular loading and thus providing a buttery smooth browsing experience. Now how did they do that?
They used a pattern called PRPL which stands for Push, Render, Pre-cache and Lazy-load. PRPL allows the browser to send to users what’s important to them as early on as possible.
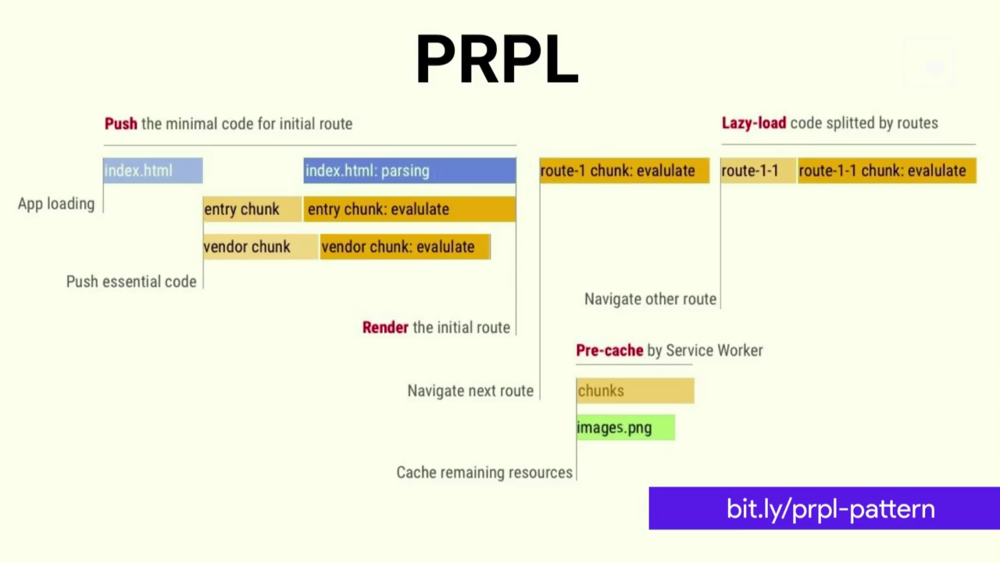
So what it does is only push ahead essential coding, then render the initial routes, then pre-caching to make available navigation data so if you have to go back and revisit it will load from the cache stored locally. And then finally lazy loading.
So by applying preload, we are able to shift the step by step loading to parallel loading and execution to decrease the time to interactivity. Now the problem with this structure is that it makes 2 round trips first fetching the necessary resources and then in the second trip loading the rest of it. So this can be fixed by HTTP/2 Server Push. Push allows us to manifest the files that are critical to the user journey. Instead of sending a request to the HTML for the code to be parsed, we can also send out the list of files that are crucial for the user experience and start having them fetched accordingly. So technically we are filling up the server runtime efficiently which is not so the case these days.
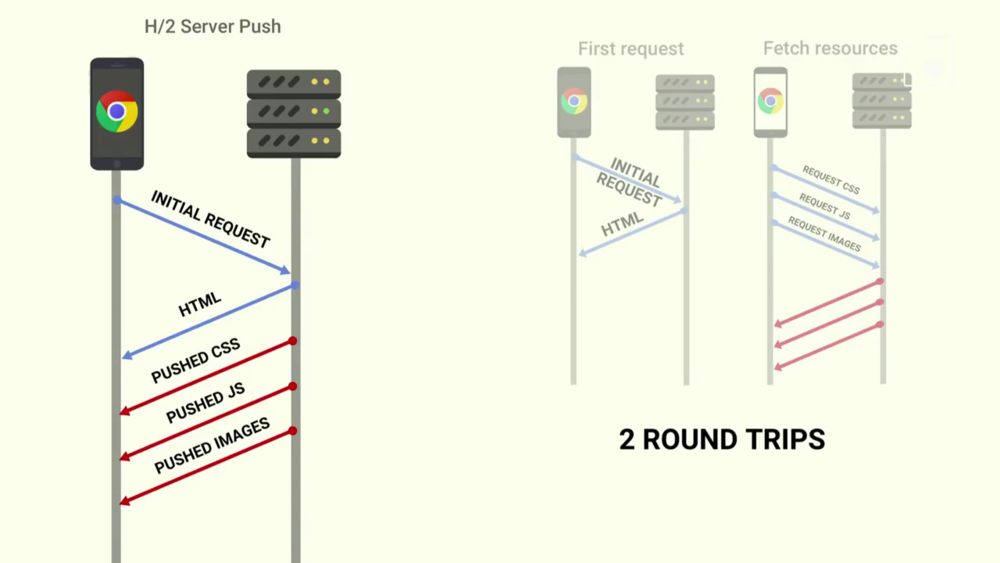
So by applying HTTP/2 Server push, we were able to save thousands of milliseconds, in general, saving a lot of time to load and get interactive with users. Now HTTP/2 Server Push can also lead to problems and is by no means the perfect answer. It is not cache aware meaning not aware of the files already present locally in the cache. This means it force pushes cache files even though they might be present already locally, hence not making it the idle choice.
Push Vs. Preload
Push cuts out an RTT whereas Preload move resource download time closer to the initial request. Push is useful if you have a service worker or a Cache Digests hence it is not cached aware and has no prioritization. Whereas Preload can process cross origin request, cache, and cookies as well as load/error events and content negotiation.
So how do we address the issue of force push so it doesn’t push more information what is already in the cache locally?Well, we can use service worker. Instead of going back to the network every time to fetch resources, it will try to get them locally from what is already stored in the cache, we avoid the issue of needing cache digest. So in the case of Shop, using PRPL by applying these strategies, we were able to boot it up in only a couple of 100 milliseconds.
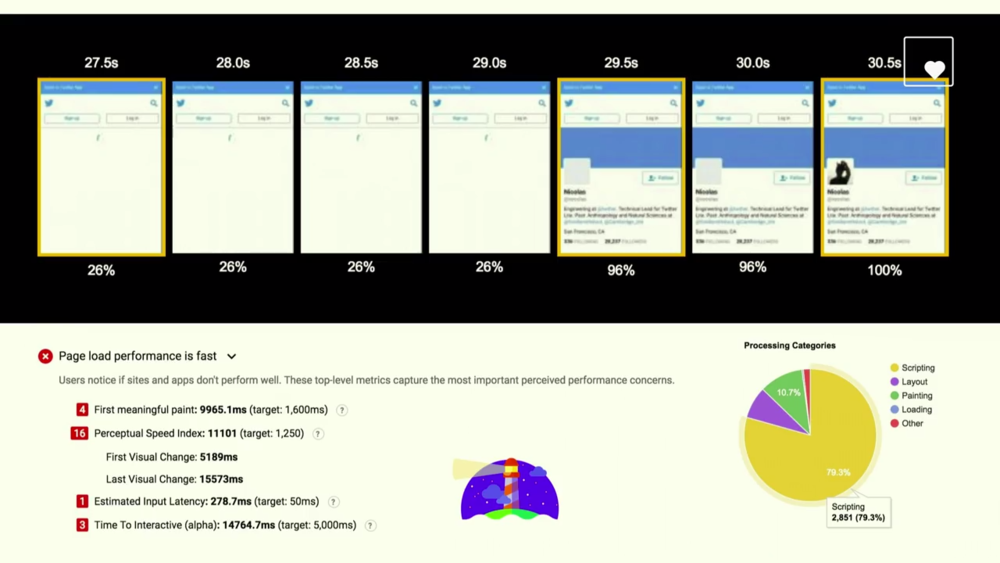
Performance of Twitter Lite
The actual Twitter application took almost 30 seconds to interactivity so that users could start tapping around the interface. They analyzed the codes and made use of patterns like PRPL. They started out with DNS pre-fetch which defines declaratively which servers to start warming up your DNS connections to. Next, they used preload to load their script up. This is very easy to setup. For a static website, it will take you about 10 minutes to setup whereas for a fullstack app it will take about an hour. This led to an overall 36% improvement in their times to interactivity.
The next step was working on rendering to put the pixels on screen much faster. Now twitter is such an application which is media rich therefore it was kind of obvious that image and media loading was what slowed down the loading. So what they did to improve that they used requestIdleCallback() to JS loading images and that led to a four times improvement in image rendering.
Another thing they noticed was that it images were not the right dimensions and also were sub-optimally encoded which led to slow decoding when they Chrome. They were able to optimize the loading time from a single image’s time of about ~300ms to the largest image being loaded in less than 20ms. This ensured images didn’t cause a bottleneck in improving interactivity.
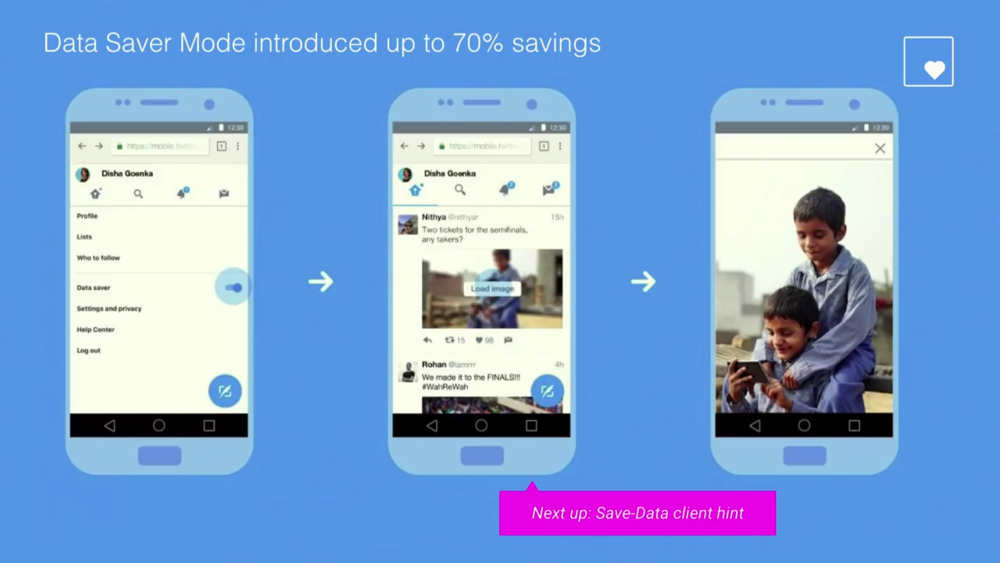
One more improvement they made to better perform Twitter app, was introducing Data Saving Mode that led to only loading images when user taps on them, which gave about 70% savings in data consumption.
Twitter also made use of pre-caching. They cached their assets, their emojis so you could reply to comments and posts and with time they ramped that up a bit to include application shell caching. These tweaks took the load time from over 6 seconds to a staggering 1.49s. Now Twitter provided with 20 versions of their run time. So it turned out, on the first load of Twitter light, there was no service worker. The second load increased performance by 47% and a third load was 65% faster.

Now coming to lazy load. So we know their time to interactivity was quite slow and needed a bit of change. So on checking, they had relatively large chunks of java scripts that were slow to load on mobile. Now you might think it is okay to for a 100KB or so to load that is still extra code that the browser has to load and work on, like parsing and compiling to boot it up. So these bundles took a bit over 5s to get ready before code splitting. Twitter correctly used vendor splitting ended up creating over 40 different asynchronous chunks that are granularly loaded as you navigate from one view to the other. The impact that had was that large bundle took 3s to fully process after code splitting. They overall improved their performances and time to interactivity making it smoother and more engaging.

One of their key learning from this was using Bundle Analyzers like Webpack Bundle Analyzers to find out what low hanging fruits they have on their bundles. These packs better help you understand what you are actually sending down the wire.

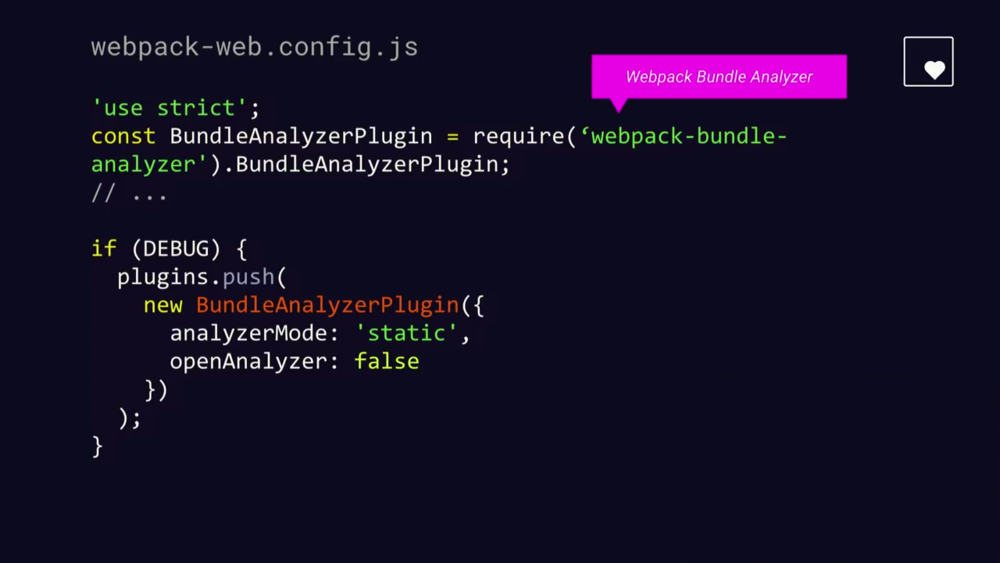
Using the bundle analyzer, they were to figure out that when someone was using the application what direct impact they had on their actual bundle shape.
Performance is a continuous game of measuring for areas to improve. If you are looking to work on performance profile improvements of your webpage, you can check out Lighthouse, a project we are working on that which is an auditing tool for not only performance metrics but also progressive web app features for general web platforms and practices.

Also try Calibre, which helps to analyze anything from your bundle size to performance metrics. Also, check out the webpage test on Github. What it does is every time you submit a pull request, it runs it and posts a small performance strip alongside your PR code which helps you figure out the impact of your code on user experience.
This article references content from the following video by Addy Osmani